News
High-resolution mapping of European fishing pressure
For the first time, scientists have created high-resolution maps of fishing pressure in the North-east Atlantic, Mediterranean and Turkish waters. These maps provide a common knowledge base to all stakeholders and are needed for an ecosystem approach to fisheries management (EAFM). The level of detail goes beyond that of previous information based solely on fishermen’s logbooks that is not well suited for quantitative estimation of seafloor impact (swept area and impact severity) of the different gears and trips. The BENTHIS team has developed a method to overcome this information deficiency of official statistics.
Individual logbook observations from 13 countries were assigned to 14 different functional gear groups (‘BENTHIS métiers’) based on target species and gear type information. Relationships between gear dimensions and vessel size (e.g. trawl door spread and vessel kW) for each métier were used to assign quantitative information of bottom contact (e.g. width of gear) to each logbook trip. The extended logbook data were combined with high-resolution activity data (VMS: satellite data). In this way the total sea bed area swept by a fishing gear over the three year period was estimated for each 1x1 minute grid cell (1.9 km2 at 56 °N). The analyses show that otter trawlers display highest intensities compared to seiners or beam trawlers. But which type of fishery has a greater impact?
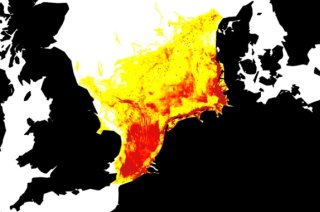
 for four different gear groups: otter trawl, beam trawl, dredge and seine. Data from Norwegian, Swedish, Danish, German, Dutch, Belgian, English and Scottish vessels in the North Sea. If a grid cell is fished 1 time in 3 years, then the total area swept is approximately 1.9 km2. A swept area of 51 km2 means that the grid cell is swept 27 times in 3 years.")
The next step in BENTHIS will be to add information of impact severity on top of the area impact estimations and to overlay the fishing pressure maps with habitat maps. Such large scale high-precision maps, where estimates of actual area and severity of impacts are included, represent a new and important step forward in meeting the indicator and monitoring requirements of the ecosystem approach to fisheries management.